Nghĩa của từ "bar graph" trong tiếng Việt
"bar graph" trong tiếng Anh có nghĩa là gì? Hãy cùng Lingoland tìm hiểu nghĩa, phát âm và cách dùng cụ thể của từ này.
bar graph
US /ˈbɑːr ˌɡræf/
UK /ˈbɑː ɡrɑːf/
Danh từ
biểu đồ cột, biểu đồ thanh
a diagram in which the numerical values of variables are represented by the height or length of lines or rectangles of equal width
Ví dụ:
•
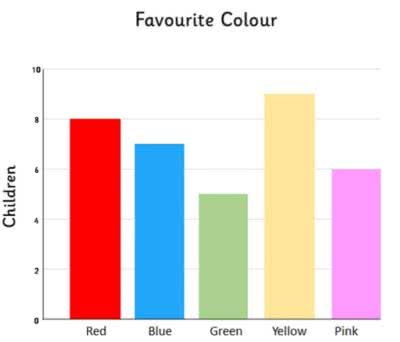
The teacher showed the students a bar graph illustrating the class's favorite colors.
Giáo viên cho học sinh xem một biểu đồ cột minh họa các màu sắc yêu thích của lớp.
•
We used a bar graph to compare the sales figures of different products.
Chúng tôi đã sử dụng biểu đồ cột để so sánh số liệu bán hàng của các sản phẩm khác nhau.
Từ đồng nghĩa:
Từ liên quan: