Nghĩa của từ "block graph" trong tiếng Việt
"block graph" trong tiếng Anh có nghĩa là gì? Hãy cùng Lingoland tìm hiểu nghĩa, phát âm và cách dùng cụ thể của từ này.
block graph
US /ˈblɑːk ˌɡræf/
UK /ˈblɒk ˌɡrɑːf/
Danh từ
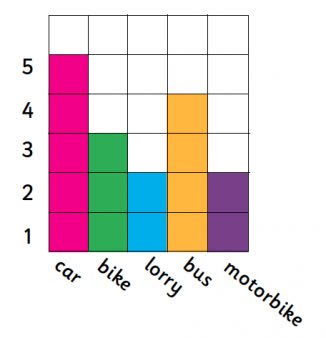
biểu đồ khối
a graph that uses blocks to represent data, where each block typically represents one unit or a specific quantity, often used for simple data visualization.
Ví dụ:
•
The teacher showed the students how to create a block graph to display the number of pets each student owned.
Giáo viên đã chỉ cho học sinh cách tạo biểu đồ khối để hiển thị số lượng thú cưng mà mỗi học sinh sở hữu.
•
We used a block graph to compare the favorite colors of the class.
Chúng tôi đã sử dụng biểu đồ khối để so sánh màu sắc yêu thích của lớp.
Từ đồng nghĩa:
Từ liên quan: