"bar graph" kelimesinin Türkçe anlamı
"bar graph" İngilizce'de ne anlama geliyor? Lingoland ile bu kelimenin anlamını, telaffuzunu ve özel kullanımını keşfedin
bar graph
US /ˈbɑːr ˌɡræf/
UK /ˈbɑː ɡrɑːf/
İsim
çubuk grafik
a diagram in which the numerical values of variables are represented by the height or length of lines or rectangles of equal width
Örnek:
•
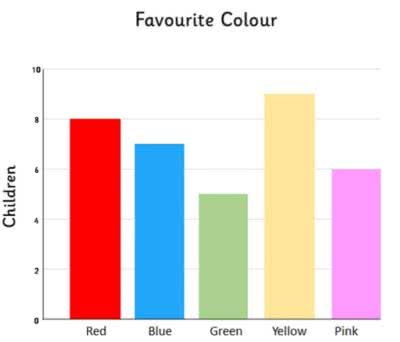
The teacher showed the students a bar graph illustrating the class's favorite colors.
Öğretmen, öğrencilere sınıfın favori renklerini gösteren bir çubuk grafik gösterdi.
•
We used a bar graph to compare the sales figures of different products.
Farklı ürünlerin satış rakamlarını karşılaştırmak için bir çubuk grafik kullandık.
Eş Anlamlı:
İlgili Kelime: