"block graph" kelimesinin Türkçe anlamı
"block graph" İngilizce'de ne anlama geliyor? Lingoland ile bu kelimenin anlamını, telaffuzunu ve özel kullanımını keşfedin
block graph
US /ˈblɑːk ˌɡræf/
UK /ˈblɒk ˌɡrɑːf/
İsim
blok grafik
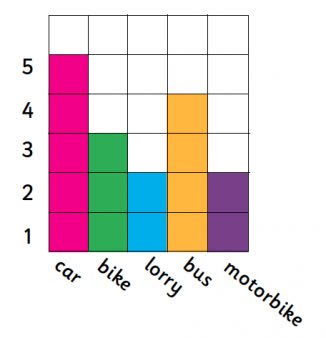
a graph that uses blocks to represent data, where each block typically represents one unit or a specific quantity, often used for simple data visualization.
Örnek:
•
The teacher showed the students how to create a block graph to display the number of pets each student owned.
Öğretmen, öğrencilere her öğrencinin sahip olduğu evcil hayvan sayısını göstermek için nasıl bir blok grafik oluşturulacağını gösterdi.
•
We used a block graph to compare the favorite colors of the class.
Sınıfın favori renklerini karşılaştırmak için bir blok grafik kullandık.
Eş Anlamlı:
İlgili Kelime: