Betekenis van het woord "pie chart" in het Nederlands
Wat betekent "pie chart" in het Engels? Ontdek de betekenis, uitspraak en specifiek gebruik van dit woord met Lingoland
pie chart
US /ˈpaɪ ˌtʃɑːrt/
UK /ˈpaɪ ˌtʃɑːt/
Zelfstandig Naamwoord
cirkeldiagram
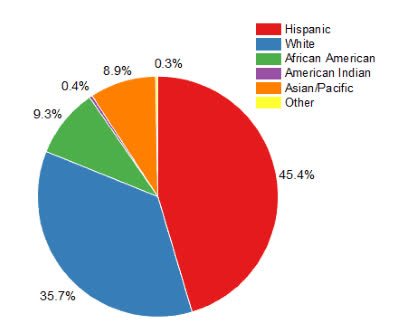
a type of graph in which a circle is divided into sectors that each represent a proportion of the whole
Voorbeeld:
•
The report included a pie chart showing the distribution of expenses.
Het rapport bevatte een cirkeldiagram dat de verdeling van de uitgaven toonde.
•
We used a pie chart to visualize the market share of different companies.
We gebruikten een cirkeldiagram om het marktaandeel van verschillende bedrijven te visualiseren.
Synoniem: