Betekenis van het woord "Gantt chart" in het Nederlands
Wat betekent "Gantt chart" in het Engels? Ontdek de betekenis, uitspraak en specifiek gebruik van dit woord met Lingoland
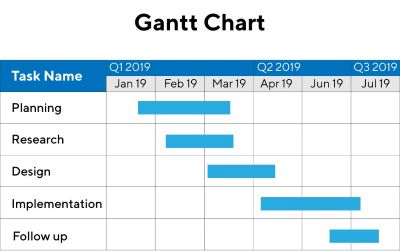
Gantt chart
US /ˈɡænt tʃɑːrt/
UK /ɡænt tʃɑːt/
Zelfstandig Naamwoord
Gantt-diagram
a chart in which a series of horizontal lines shows the amount of work done or completed in certain periods of time in a project
Voorbeeld:
•
The project manager used a Gantt chart to visualize the project timeline and task dependencies.
De projectmanager gebruikte een Gantt-diagram om de projecttijdlijn en taakafhankelijkheden te visualiseren.
•
Creating a detailed Gantt chart helps in effective project planning and tracking.
Het maken van een gedetailleerd Gantt-diagram helpt bij effectieve projectplanning en -tracking.
Synoniem:
Gerelateerd Woord: