Significado da palavra "bar graph" em português
O que significa "bar graph" em inglês? Descubra o significado, a pronúncia e o uso específico desta palavra com a Lingoland
bar graph
US /ˈbɑːr ˌɡræf/
UK /ˈbɑː ɡrɑːf/
Substantivo
gráfico de barras
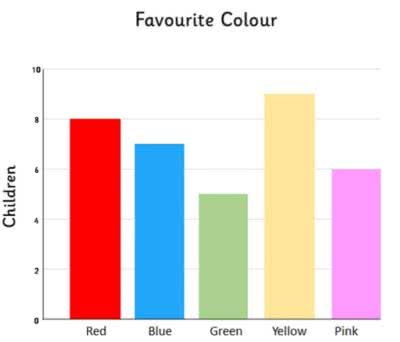
a diagram in which the numerical values of variables are represented by the height or length of lines or rectangles of equal width
Exemplo:
•
The teacher showed the students a bar graph illustrating the class's favorite colors.
O professor mostrou aos alunos um gráfico de barras ilustrando as cores favoritas da turma.
•
We used a bar graph to compare the sales figures of different products.
Usamos um gráfico de barras para comparar os números de vendas de diferentes produtos.
Sinónimo:
Palavra Relacionada: