Significado da palavra "block graph" em português
O que significa "block graph" em inglês? Descubra o significado, a pronúncia e o uso específico desta palavra com a Lingoland
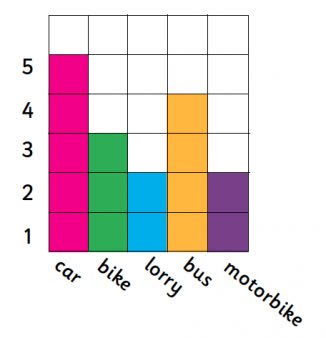
block graph
US /ˈblɑːk ˌɡræf/
UK /ˈblɑːk ˌɡræf/

Substantivo
1.
gráfico de blocos
a graph that uses blocks to represent data, where each block typically represents one unit or a specific quantity, often used for simple data visualization.
Exemplo:
•
The teacher showed the students how to create a block graph to display the number of pets each student owned.
O professor mostrou aos alunos como criar um gráfico de blocos para exibir o número de animais de estimação que cada aluno possuía.
•
We used a block graph to compare the favorite colors of the class.
Usamos um gráfico de blocos para comparar as cores favoritas da turma.
Sinónimo:
Aprender esta palavra no Lingoland
Palavra Relacionada: