
IELTS アカデミック語彙(バンド5) 内 グラフと画像 語彙セット:完全かつ詳細なリスト
「IELTS アカデミック語彙(バンド5)」内の「グラフと画像」語彙セットは国際標準教材から厳選され、短期間で語彙をマスターできます。定義、例文、標準発音を網羅…
Lingolandでこの語彙セットを学習
今すぐ学習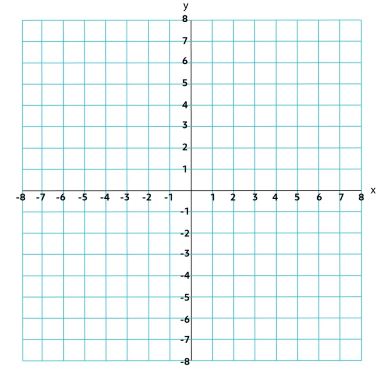
/ɡræf/
(noun) グラフ, 図;
(verb) グラフ化する, 図示する
例:
The report included a graph showing sales trends over the last quarter.
レポートには、過去四半期の売上傾向を示すグラフが含まれていました。
/tʃɑːrt/
(noun) 図, グラフ, 海図;
(verb) 図示する, 記録する, 追跡する
例:
The sales figures are shown on the chart.
売上高はグラフに示されています。

/ˈdaɪ.ə.ɡræm/
(noun) 図, 図表, ダイヤグラム;
(verb) 図示する, 図解する
例:
The teacher drew a diagram of the human heart on the board.
先生は黒板に人間の心臓の図を描いた。

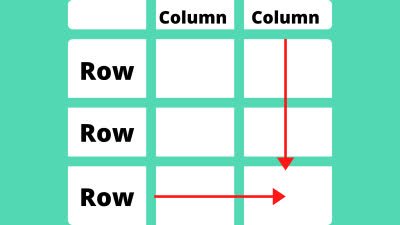
/ˈteɪ.bəl/
(noun) テーブル, 食卓, 表;
(verb) 棚上げする, 延期する
例:
We gathered around the kitchen table for dinner.
私たちは夕食のためにキッチンテーブルの周りに集まった。

/piːk/
(noun) ピーク, 頂点, 頂上;
(verb) ピークに達する, 頂点に達する;
(adjective) ピークの, 最高の
例:
The athlete reached the peak of his career at the age of 28.
その選手は28歳でキャリアの頂点に達した。

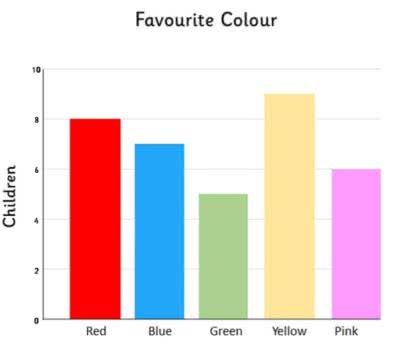
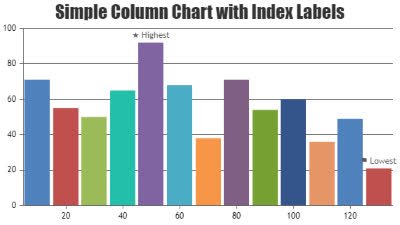
/ˈbɑːr ˌtʃɑːrt/
(noun) 棒グラフ
例:
The sales data was presented in a clear bar chart.
販売データは明確な棒グラフで示されました。
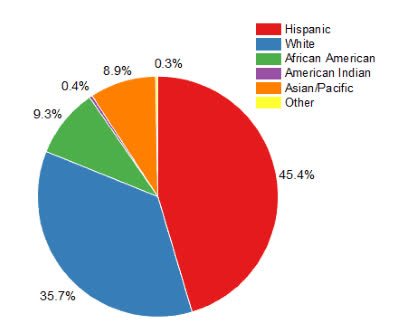
/ˈpaɪ ˌtʃɑːrt/
(noun) 円グラフ
例:
The report included a pie chart showing the distribution of expenses.
レポートには、費用の分布を示す円グラフが含まれていました。
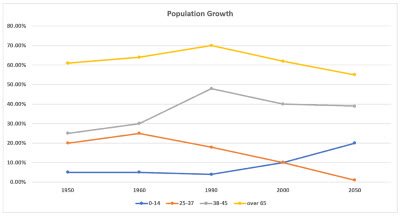
/ˈlaɪn ˌɡræf/
(noun) 折れ線グラフ
例:
The sales data was presented using a line graph to show trends over the last quarter.
過去四半期の傾向を示すために、売上データは折れ線グラフで提示されました。

/ˈziːˌæk.sɪs/
(noun) z軸
例:
In this 3D model, the z-axis represents the height of the building.
この3Dモデルでは、z軸が建物の高さを表しています。
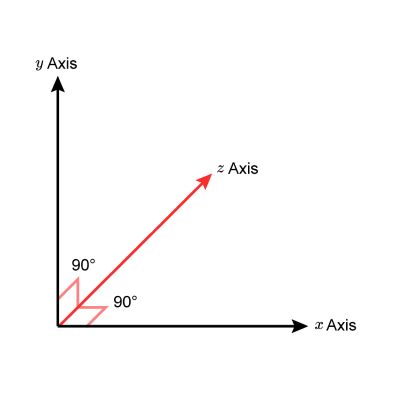
/ˈwaɪˌæk.sɪs/
(noun) y軸
例:
The height of the bars is measured along the y-axis.
棒の高さはy軸に沿って測定されます。

/ˈeksˌæk.sɪs/
(noun) x軸
例:
The time is plotted along the x-axis of the graph.
時間はグラフのx軸に沿ってプロットされています。