
词汇集 图表和图像(属于 雅思学术词汇(5级)):完整且详细的清单
词汇集「图表和图像」(属于「雅思学术词汇(5级)」)从国际标准教材来源精心挑选,帮助您在短时间内掌握词汇。全面汇整定义、例句及标准发音…
在 Lingoland 学习此词汇集
立即学习
/ɡræf/
(noun) 图表, 图形;
(verb) 绘制图表, 作图
示例:
The report included a graph showing sales trends over the last quarter.
报告中包含了一张显示上季度销售趋势的图表。
/tʃɑːrt/
(noun) 图表, 海图, 图;
(verb) 绘制, 记录, 跟踪
示例:
The sales figures are shown on the chart.
销售数据显示在图表上。

/ˈdaɪ.ə.ɡræm/
(noun) 图, 图表, 示意图;
(verb) 绘制图表, 图解
示例:
The teacher drew a diagram of the human heart on the board.
老师在黑板上画了一个人体心脏的图表。

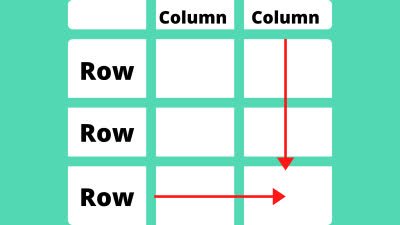
/ˈteɪ.bəl/
(noun) 桌子, 餐桌, 表格;
(verb) 搁置, 提交
示例:
We gathered around the kitchen table for dinner.
我们围坐在厨房餐桌旁吃晚饭。

/piːk/
(noun) 高峰, 顶点, 山顶;
(verb) 达到顶峰, 达到高峰;
(adjective) 高峰, 最高
示例:
The athlete reached the peak of his career at the age of 28.
这位运动员在28岁时达到了职业生涯的巅峰。

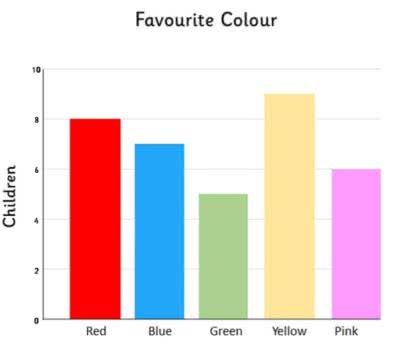
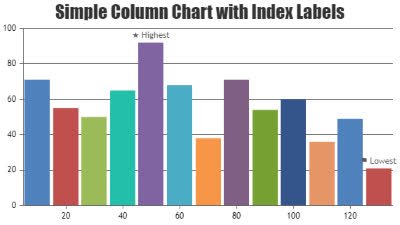
/ˈbɑːr ˌtʃɑːrt/
(noun) 条形图, 柱状图
示例:
The sales data was presented in a clear bar chart.
销售数据以清晰的条形图呈现。
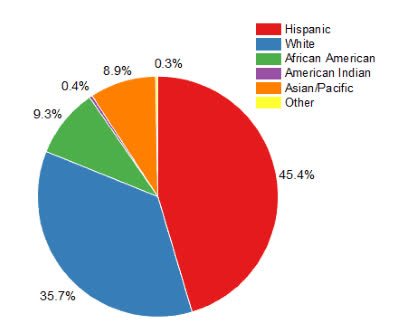
/ˈpaɪ ˌtʃɑːrt/
(noun) 饼图
示例:
The report included a pie chart showing the distribution of expenses.
报告中包含一个显示支出分布的饼图。
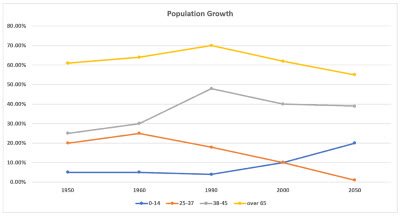
/ˈlaɪn ˌɡræf/
(noun) 折线图
示例:
The sales data was presented using a line graph to show trends over the last quarter.
销售数据用折线图展示,以显示上季度的趋势。

/ˈziːˌæk.sɪs/
(noun) z轴
示例:
In this 3D model, the z-axis represents the height of the building.
在这个3D模型中,z轴代表建筑的高度。
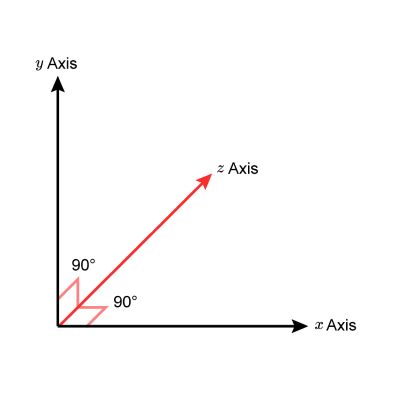
/ˈwaɪˌæk.sɪs/
(noun) y轴, 纵轴
示例:
The height of the bars is measured along the y-axis.
柱状图的高度是沿y轴测量的。

/ˈeksˌæk.sɪs/
(noun) x 轴, 横轴
示例:
The time is plotted along the x-axis of the graph.
时间绘制在图表的 x 轴上。