
Graphs and Figures Vocabulary Set in IELTS Academic (Band 5): Full and Detailed List
The 'Graphs and Figures' vocabulary set in 'IELTS Academic (Band 5)' is carefully selected from standard international textbook sources, helping you master vocabulary in a short time. Comprehensive compilation of definitions, illustrative examples, and standard pronunciation...
Learn this vocabulary set on Lingoland
Learn Now
/ɡræf/
Example:
The report included a graph showing sales trends over the last quarter.
/tʃɑːrt/
Example:
The sales figures are shown on the chart.

/ˈdaɪ.ə.ɡræm/
Example:
The teacher drew a diagram of the human heart on the board.

/ˈteɪ.bəl/
Example:
We gathered around the kitchen table for dinner.

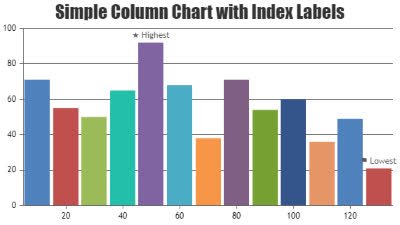
/piːk/
Example:
The athlete reached the peak of his career at the age of 28.

/ˈkɑː.ləm/
Example:
The data is organized into three columns.
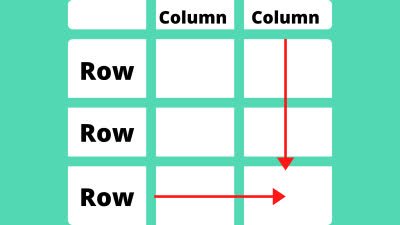
/roʊ/
Example:
The children sat in a row.
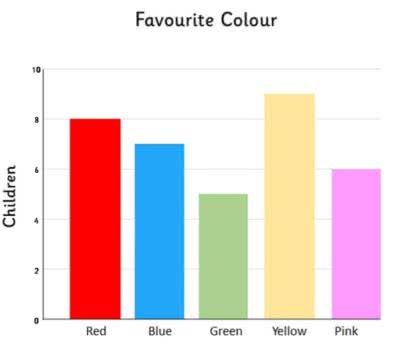
/ˈbɑːr ˌtʃɑːrt/
Example:
The sales data was presented in a clear bar chart.
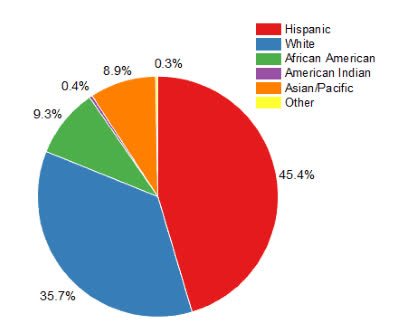
/ˈpaɪ ˌtʃɑːrt/
Example:
The report included a pie chart showing the distribution of expenses.
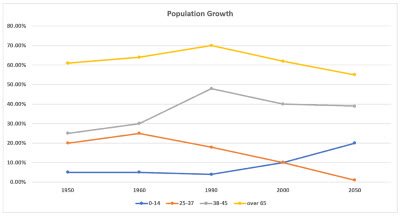
/ˈlaɪn ˌɡræf/
Example:
The sales data was presented using a line graph to show trends over the last quarter.

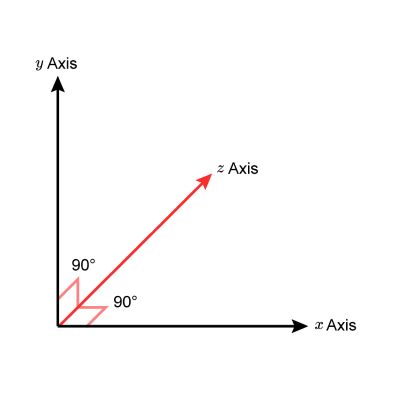
/ˈziːˌæk.sɪs/
Example:
In this 3D model, the z-axis represents the height of the building.
/ˈwaɪˌæk.sɪs/
Example:
The height of the bars is measured along the y-axis.

/ˈeksˌæk.sɪs/
Example:
The time is plotted along the x-axis of the graph.