
詞彙集 圖表和圖像(屬於 雅思學術字彙(5級)):完整且詳細的清單
詞彙集「圖表和圖像」(屬於「雅思學術字彙(5級)」)從國際標準教材來源精心挑選,幫助您在短時間內掌握詞彙。全面彙整定義、例句及標準發音…
在 Lingoland 學習此詞彙集
立即學習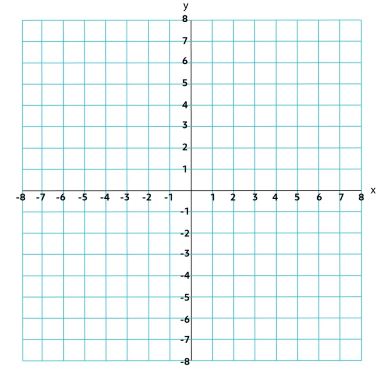
/ɡræf/
(noun) 圖表, 圖形;
(verb) 繪製圖表, 作圖
範例:
The report included a graph showing sales trends over the last quarter.
報告中包含了一張顯示上季度銷售趨勢的圖表。
/tʃɑːrt/
(noun) 圖表, 海圖, 圖;
(verb) 繪製, 記錄, 追蹤
範例:
The sales figures are shown on the chart.
銷售數據顯示在圖表上。

/ˈdaɪ.ə.ɡræm/
(noun) 圖, 圖表, 示意圖;
(verb) 繪製圖表, 圖解
範例:
The teacher drew a diagram of the human heart on the board.
老師在黑板上畫了一個人體心臟的圖表。

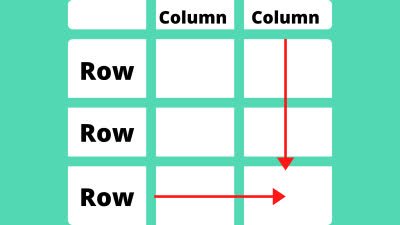
/ˈteɪ.bəl/
(noun) 桌子, 餐桌, 表格;
(verb) 擱置, 提交
範例:
We gathered around the kitchen table for dinner.
我們圍坐在廚房餐桌旁吃晚飯。

/piːk/
(noun) 高峰, 頂點, 山頂;
(verb) 達到頂峰, 達到高峰;
(adjective) 高峰, 最高
範例:
The athlete reached the peak of his career at the age of 28.
這位運動員在28歲時達到了職業生涯的巔峰。

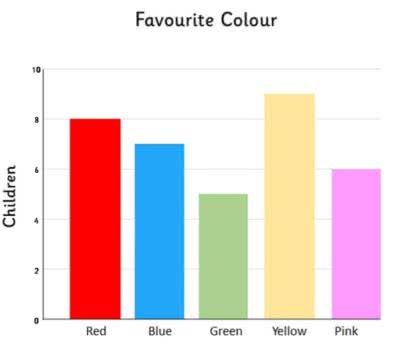
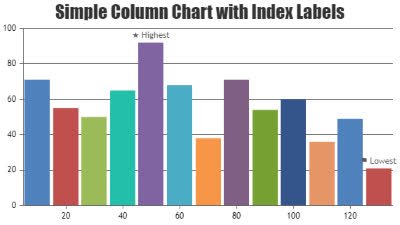
/ˈbɑːr ˌtʃɑːrt/
(noun) 條形圖, 柱狀圖
範例:
The sales data was presented in a clear bar chart.
銷售數據以清晰的條形圖呈現。
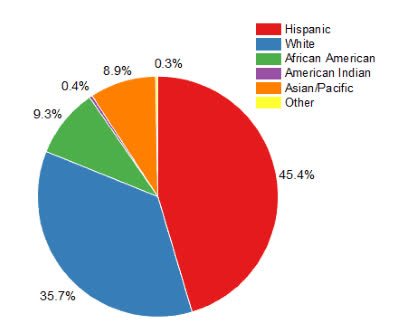
/ˈpaɪ ˌtʃɑːrt/
(noun) 餅圖
範例:
The report included a pie chart showing the distribution of expenses.
報告中包含一個顯示支出分佈的餅圖。
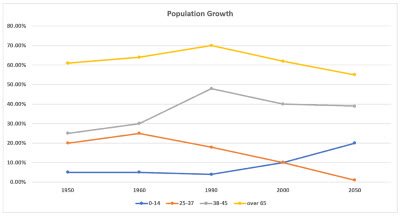
/ˈlaɪn ˌɡræf/
(noun) 折線圖
範例:
The sales data was presented using a line graph to show trends over the last quarter.
銷售數據用折線圖展示,以顯示上季度的趨勢。

/ˈziːˌæk.sɪs/
(noun) z軸
範例:
In this 3D model, the z-axis represents the height of the building.
在這個3D模型中,z軸代表建築的高度。
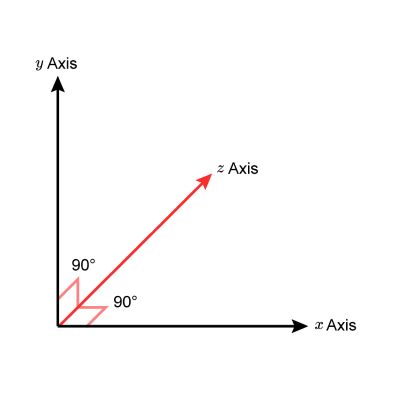
/ˈwaɪˌæk.sɪs/
(noun) y軸, 縱軸
範例:
The height of the bars is measured along the y-axis.
柱狀圖的高度是沿y軸測量的。

/ˈeksˌæk.sɪs/
(noun) x 軸, 橫軸
範例:
The time is plotted along the x-axis of the graph.
時間繪製在圖表的 x 軸上。