Signification du mot "bar graph" en français
Que signifie "bar graph" en anglais ? Découvrez la signification, la prononciation et l'utilisation spécifique de ce mot avec Lingoland
bar graph
US /ˈbɑːr ˌɡræf/
UK /ˈbɑː ɡrɑːf/
Nom
graphique à barres, diagramme à barres
a diagram in which the numerical values of variables are represented by the height or length of lines or rectangles of equal width
Exemple:
•
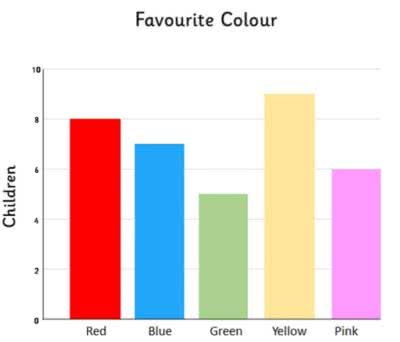
The teacher showed the students a bar graph illustrating the class's favorite colors.
Le professeur a montré aux élèves un graphique à barres illustrant les couleurs préférées de la classe.
•
We used a bar graph to compare the sales figures of different products.
Nous avons utilisé un graphique à barres pour comparer les chiffres de vente des différents produits.
Synonyme:
Mot Associé: