Signification du mot "block graph" en français
Que signifie "block graph" en anglais ? Découvrez la signification, la prononciation et l'utilisation spécifique de ce mot avec Lingoland
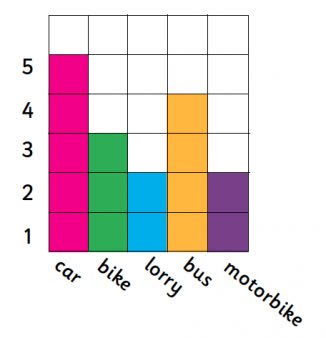
block graph
US /ˈblɑːk ˌɡræf/
UK /ˈblɒk ˌɡrɑːf/
Nom
graphique en blocs
a graph that uses blocks to represent data, where each block typically represents one unit or a specific quantity, often used for simple data visualization.
Exemple:
•
The teacher showed the students how to create a block graph to display the number of pets each student owned.
Le professeur a montré aux élèves comment créer un graphique en blocs pour afficher le nombre d'animaux de compagnie que chaque élève possédait.
•
We used a block graph to compare the favorite colors of the class.
Nous avons utilisé un graphique en blocs pour comparer les couleurs préférées de la classe.
Synonyme:
Mot Associé: