Significado de la palabra "pie chart" en español
¿Qué significa "pie chart" en inglés? Descubre el significado, la pronunciación y el uso específico de esta palabra con Lingoland
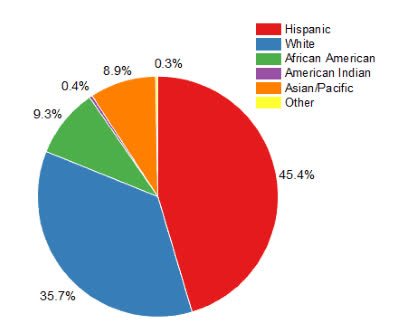
pie chart
US /ˈpaɪ ˌtʃɑːrt/
UK /ˈpaɪ ˌtʃɑːt/
Sustantivo
gráfico circular, diagrama de pastel
a type of graph in which a circle is divided into sectors that each represent a proportion of the whole
Ejemplo:
•
The report included a pie chart showing the distribution of expenses.
El informe incluía un gráfico circular que mostraba la distribución de los gastos.
•
We used a pie chart to visualize the market share of different companies.
Utilizamos un gráfico circular para visualizar la cuota de mercado de diferentes empresas.
Sinónimo:
Palabra Relacionada: