Significado de la palabra "Gantt chart" en español
¿Qué significa "Gantt chart" en inglés? Descubre el significado, la pronunciación y el uso específico de esta palabra con Lingoland
Gantt chart
US /ˈɡænt tʃɑːrt/
UK /ɡænt tʃɑːt/
Sustantivo
diagrama de Gantt
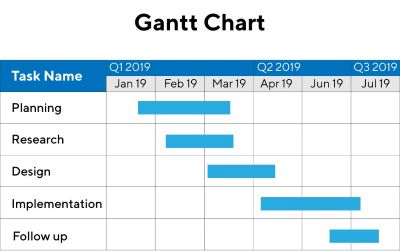
a chart in which a series of horizontal lines shows the amount of work done or completed in certain periods of time in a project
Ejemplo:
•
The project manager used a Gantt chart to visualize the project timeline and task dependencies.
El gerente de proyecto utilizó un diagrama de Gantt para visualizar la línea de tiempo del proyecto y las dependencias de las tareas.
•
Creating a detailed Gantt chart helps in effective project planning and tracking.
Crear un diagrama de Gantt detallado ayuda en la planificación y el seguimiento efectivos del proyecto.
Sinónimo:
Palabra Relacionada: