Meaning of the word graph in English
What does graph mean in English? Explore the meaning, pronunciation, and specific usage of this word with Lingoland.
graph
US /ɡræf/
UK /ɡræf/

Noun
1.
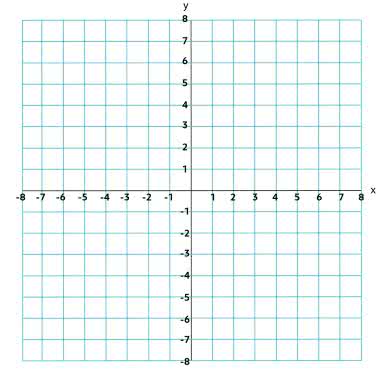
a diagram showing the relationship between variable quantities, typically of two variables, each measured along one of a pair of axes at right angles.
Example:
•
The report included a graph showing sales trends over the last quarter.
•
We need to plot these data points on a graph.
Verb
Learn This Word at Lingoland
Related Word: