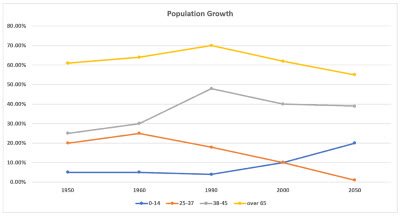
line graph
US /ˈlaɪn ˌɡræf/
UK /ˈlaɪn ˌɡræf/

名词
1.
折线图
a graph that uses points connected by lines to show how something changes over time or in relation to something else
示例:
•
The sales data was presented using a line graph to show trends over the last quarter.
销售数据用折线图展示,以显示上季度的趋势。
•
A line graph is often used to visualize changes in temperature over a day.
折线图常用于可视化一天中的温度变化。
同义词:
在 Lingoland 学习这个单词