block graph
US /ˈblɑːk ˌɡræf/
UK /ˈblɒk ˌɡrɑːf/
名词
块状图
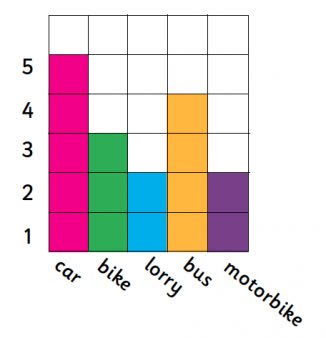
a graph that uses blocks to represent data, where each block typically represents one unit or a specific quantity, often used for simple data visualization.
示例:
•
The teacher showed the students how to create a block graph to display the number of pets each student owned.
老师向学生们展示了如何创建块状图来显示每个学生拥有的宠物数量。
•
We used a block graph to compare the favorite colors of the class.
我们使用块状图来比较班级最喜欢的颜色。