pie chart
US /ˈpaɪ ˌtʃɑːrt/
UK /ˈpaɪ ˌtʃɑːt/
名詞
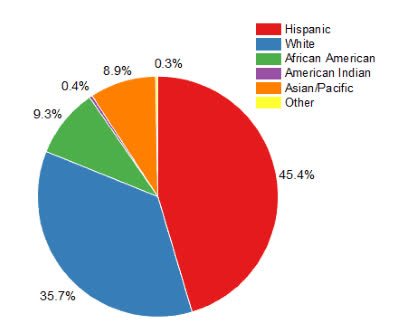
餅圖
a type of graph in which a circle is divided into sectors that each represent a proportion of the whole
範例:
•
The report included a pie chart showing the distribution of expenses.
報告中包含一個顯示支出分佈的餅圖。
•
We used a pie chart to visualize the market share of different companies.
我們使用餅圖來可視化不同公司的市場份額。
同義詞: