Gantt chart
US /ˈɡænt tʃɑːrt/
UK /ɡænt tʃɑːt/
名詞
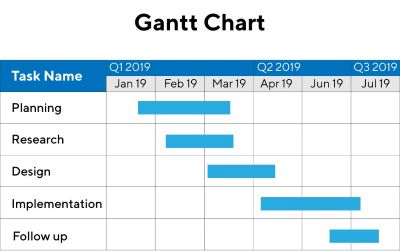
甘特圖
a chart in which a series of horizontal lines shows the amount of work done or completed in certain periods of time in a project
範例:
•
The project manager used a Gantt chart to visualize the project timeline and task dependencies.
項目經理使用甘特圖來可視化項目時間表和任務依賴關係。
•
Creating a detailed Gantt chart helps in effective project planning and tracking.
創建詳細的甘特圖有助於有效的項目規劃和跟踪。