ความหมายของคำ "Gantt chart" ในภาษาไทย
"Gantt chart" ในภาษาอังกฤษหมายถึงอะไร? มาร่วมค้นหาความหมาย การออกเสียง และวิธีใช้คำนี้อย่างละเอียดกับ Lingoland
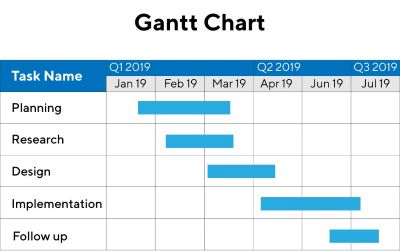
Gantt chart
US /ˈɡænt tʃɑːrt/
UK /ɡænt tʃɑːt/
คำนาม
แผนภูมิแกนต์
a chart in which a series of horizontal lines shows the amount of work done or completed in certain periods of time in a project
ตัวอย่าง:
•
The project manager used a Gantt chart to visualize the project timeline and task dependencies.
ผู้จัดการโครงการใช้แผนภูมิแกนต์เพื่อแสดงภาพไทม์ไลน์ของโครงการและการพึ่งพางาน
•
Creating a detailed Gantt chart helps in effective project planning and tracking.
การสร้างแผนภูมิแกนต์โดยละเอียดช่วยในการวางแผนและติดตามโครงการได้อย่างมีประสิทธิภาพ
คำพ้องความหมาย:
คำที่เกี่ยวข้อง: