ความหมายของคำ "pie chart" ในภาษาไทย
"pie chart" ในภาษาอังกฤษหมายถึงอะไร? มาร่วมค้นหาความหมาย การออกเสียง และวิธีใช้คำนี้อย่างละเอียดกับ Lingoland
pie chart
US /ˈpaɪ ˌtʃɑːrt/
UK /ˈpaɪ ˌtʃɑːt/
คำนาม
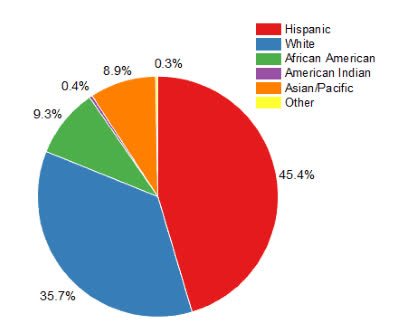
แผนภูมิวงกลม
a type of graph in which a circle is divided into sectors that each represent a proportion of the whole
ตัวอย่าง:
•
The report included a pie chart showing the distribution of expenses.
รายงานมีแผนภูมิวงกลมแสดงการกระจายของค่าใช้จ่าย
•
We used a pie chart to visualize the market share of different companies.
เราใช้แผนภูมิวงกลมเพื่อแสดงส่วนแบ่งการตลาดของบริษัทต่างๆ
คำพ้องความหมาย: