ความหมายของคำ "block graph" ในภาษาไทย
"block graph" ในภาษาอังกฤษหมายถึงอะไร? มาร่วมค้นหาความหมาย การออกเสียง และวิธีใช้คำนี้อย่างละเอียดกับ Lingoland
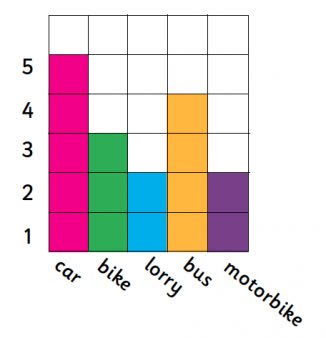
block graph
US /ˈblɑːk ˌɡræf/
UK /ˈblɒk ˌɡrɑːf/
คำนาม
กราฟแท่ง
a graph that uses blocks to represent data, where each block typically represents one unit or a specific quantity, often used for simple data visualization.
ตัวอย่าง:
•
The teacher showed the students how to create a block graph to display the number of pets each student owned.
ครูแสดงให้นักเรียนเห็นวิธีการสร้างกราฟแท่งเพื่อแสดงจำนวนสัตว์เลี้ยงที่นักเรียนแต่ละคนเป็นเจ้าของ
•
We used a block graph to compare the favorite colors of the class.
เราใช้กราฟแท่งเพื่อเปรียบเทียบสีโปรดของชั้นเรียน
คำพ้องความหมาย:
คำที่เกี่ยวข้อง: