ความหมายของคำ "bar graph" ในภาษาไทย
"bar graph" ในภาษาอังกฤษหมายถึงอะไร? มาร่วมค้นหาความหมาย การออกเสียง และวิธีใช้คำนี้อย่างละเอียดกับ Lingoland
bar graph
US /ˈbɑːr ˌɡræf/
UK /ˈbɑː ɡrɑːf/
คำนาม
กราฟแท่ง
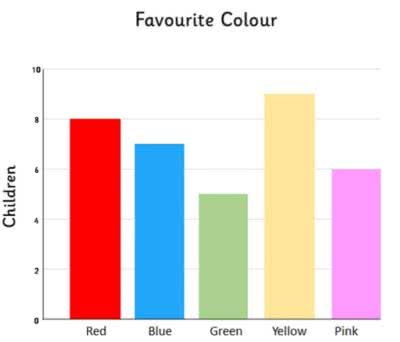
a diagram in which the numerical values of variables are represented by the height or length of lines or rectangles of equal width
ตัวอย่าง:
•
The teacher showed the students a bar graph illustrating the class's favorite colors.
ครูแสดงกราฟแท่งให้นักเรียนดูเพื่อแสดงสีโปรดของชั้นเรียน
•
We used a bar graph to compare the sales figures of different products.
เราใช้กราฟแท่งเพื่อเปรียบเทียบยอดขายของผลิตภัณฑ์ต่างๆ
คำพ้องความหมาย:
คำที่เกี่ยวข้อง: