Significado da palavra "Gantt chart" em português
O que significa "Gantt chart" em inglês? Descubra o significado, a pronúncia e o uso específico desta palavra com a Lingoland
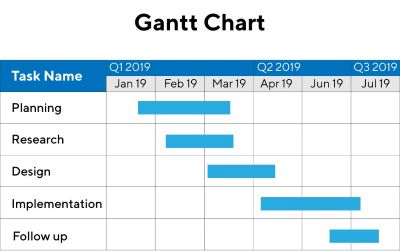
Gantt chart
US /ˈɡænt tʃɑːrt/
UK /ɡænt tʃɑːt/
Substantivo
gráfico de Gantt
a chart in which a series of horizontal lines shows the amount of work done or completed in certain periods of time in a project
Exemplo:
•
The project manager used a Gantt chart to visualize the project timeline and task dependencies.
O gerente de projeto usou um gráfico de Gantt para visualizar a linha do tempo do projeto e as dependências das tarefas.
•
Creating a detailed Gantt chart helps in effective project planning and tracking.
A criação de um gráfico de Gantt detalhado ajuda no planejamento e rastreamento eficazes do projeto.
Sinónimo:
Palavra Relacionada: