Znaczenie słowa "line graph" po polsku
Co oznacza "line graph" po angielsku? Poznaj znaczenie, wymowę i specyficzne użycie tego słowa z Lingoland
line graph
US /ˈlaɪn ˌɡræf/
UK /ˈlaɪn ɡrɑːf/
Rzeczownik
wykres liniowy
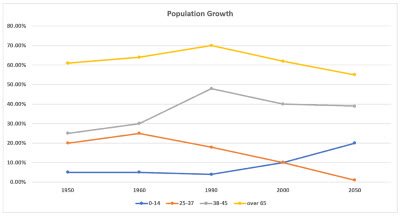
a graph that uses points connected by lines to show how something changes over time or in relation to something else
Przykład:
•
The sales data was presented using a line graph to show trends over the last quarter.
Dane sprzedażowe zostały przedstawione za pomocą wykresu liniowego, aby pokazać trendy z ostatniego kwartału.
•
A line graph is often used to visualize changes in temperature over a day.
Wykres liniowy jest często używany do wizualizacji zmian temperatury w ciągu dnia.
Synonim:
Powiązane Słowo: