Znaczenie słowa "bar graph" po polsku
Co oznacza "bar graph" po angielsku? Poznaj znaczenie, wymowę i specyficzne użycie tego słowa z Lingoland
bar graph
US /ˈbɑːr ˌɡræf/
UK /ˈbɑː ɡrɑːf/
Rzeczownik
wykres słupkowy
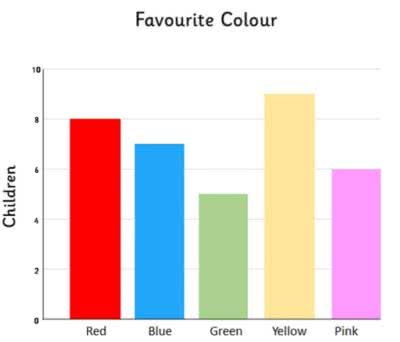
a diagram in which the numerical values of variables are represented by the height or length of lines or rectangles of equal width
Przykład:
•
The teacher showed the students a bar graph illustrating the class's favorite colors.
Nauczyciel pokazał uczniom wykres słupkowy ilustrujący ulubione kolory klasy.
•
We used a bar graph to compare the sales figures of different products.
Użyliśmy wykresu słupkowego do porównania danych sprzedaży różnych produktów.
Synonim:
Powiązane Słowo: