Maksud perkataan "bar graph" dalam bahasa Melayu
Apakah maksud "bar graph" dalam bahasa Inggeris? Terokai maksud, sebutan dan penggunaan khusus perkataan ini bersama Lingoland
bar graph
US /ˈbɑːr ˌɡræf/
UK /ˈbɑː ɡrɑːf/
Kata Nama
graf bar
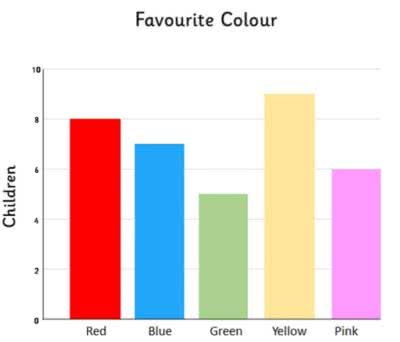
a diagram in which the numerical values of variables are represented by the height or length of lines or rectangles of equal width
Contoh:
•
The teacher showed the students a bar graph illustrating the class's favorite colors.
Guru menunjukkan kepada pelajar graf bar yang menggambarkan warna kegemaran kelas.
•
We used a bar graph to compare the sales figures of different products.
Kami menggunakan graf bar untuk membandingkan angka jualan produk yang berbeza.
Sinonim:
Kata Berkaitan: