"pie chart" 단어의 한국어 의미
"pie chart"는 영어로 무엇을 의미하나요? Lingoland와 함께 이 단어의 의미, 발음 및 구체적인 사용법을 알아보세요
pie chart
US /ˈpaɪ ˌtʃɑːrt/
UK /ˈpaɪ ˌtʃɑːt/
명사
원형 차트, 파이 차트
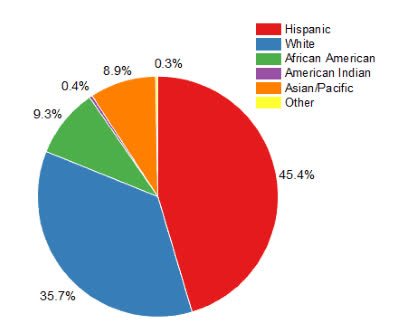
a type of graph in which a circle is divided into sectors that each represent a proportion of the whole
예시:
•
The report included a pie chart showing the distribution of expenses.
보고서에는 지출 분포를 보여주는 원형 차트가 포함되어 있었습니다.
•
We used a pie chart to visualize the market share of different companies.
우리는 다른 회사들의 시장 점유율을 시각화하기 위해 원형 차트를 사용했습니다.
동의어: