"Gantt chart" 단어의 한국어 의미
"Gantt chart"는 영어로 무엇을 의미하나요? Lingoland와 함께 이 단어의 의미, 발음 및 구체적인 사용법을 알아보세요
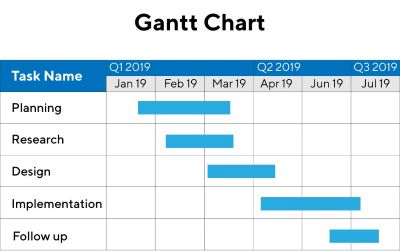
Gantt chart
US /ˈɡænt tʃɑːrt/
UK /ɡænt tʃɑːt/
명사
간트 차트
a chart in which a series of horizontal lines shows the amount of work done or completed in certain periods of time in a project
예시:
•
The project manager used a Gantt chart to visualize the project timeline and task dependencies.
프로젝트 관리자는 프로젝트 타임라인과 작업 종속성을 시각화하기 위해 간트 차트를 사용했습니다.
•
Creating a detailed Gantt chart helps in effective project planning and tracking.
상세한 간트 차트를 작성하는 것은 효과적인 프로젝트 계획 및 추적에 도움이 됩니다.