"line graph" 단어의 한국어 의미
"line graph"는 영어로 무엇을 의미하나요? Lingoland와 함께 이 단어의 의미, 발음 및 구체적인 사용법을 알아보세요
line graph
US /ˈlaɪn ˌɡræf/
UK /ˈlaɪn ɡrɑːf/
명사
선 그래프, 꺾은선 그래프
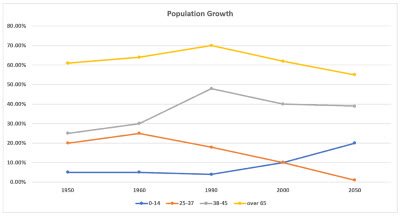
a graph that uses points connected by lines to show how something changes over time or in relation to something else
예시:
•
The sales data was presented using a line graph to show trends over the last quarter.
지난 분기 동안의 추세를 보여주기 위해 판매 데이터는 선 그래프를 사용하여 제시되었습니다.
•
A line graph is often used to visualize changes in temperature over a day.
선 그래프는 하루 동안의 온도 변화를 시각화하는 데 자주 사용됩니다.
동의어:
관련 단어: