"block graph" 단어의 한국어 의미
"block graph"는 영어로 무엇을 의미하나요? Lingoland와 함께 이 단어의 의미, 발음 및 구체적인 사용법을 알아보세요
block graph
US /ˈblɑːk ˌɡræf/
UK /ˈblɒk ˌɡrɑːf/
명사
블록 그래프
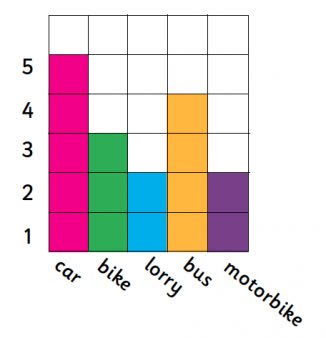
a graph that uses blocks to represent data, where each block typically represents one unit or a specific quantity, often used for simple data visualization.
예시:
•
The teacher showed the students how to create a block graph to display the number of pets each student owned.
선생님은 학생들에게 각 학생이 소유한 애완동물의 수를 표시하기 위해 블록 그래프를 만드는 방법을 보여주었습니다.
•
We used a block graph to compare the favorite colors of the class.
우리는 반에서 가장 좋아하는 색깔을 비교하기 위해 블록 그래프를 사용했습니다.