pie chart
US /ˈpaɪ ˌtʃɑːrt/
UK /ˈpaɪ ˌtʃɑːt/
名詞
円グラフ
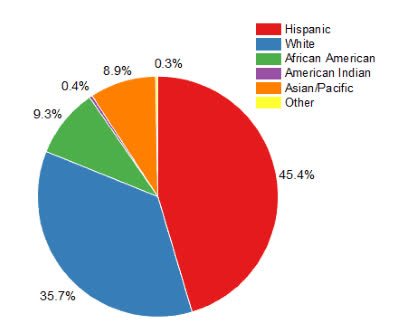
a type of graph in which a circle is divided into sectors that each represent a proportion of the whole
例:
•
The report included a pie chart showing the distribution of expenses.
レポートには、費用の分布を示す円グラフが含まれていました。
•
We used a pie chart to visualize the market share of different companies.
異なる企業の市場シェアを視覚化するために円グラフを使用しました。
同義語: