Gantt chart
US /ˈɡænt tʃɑːrt/
UK /ɡænt tʃɑːt/
名詞
ガントチャート
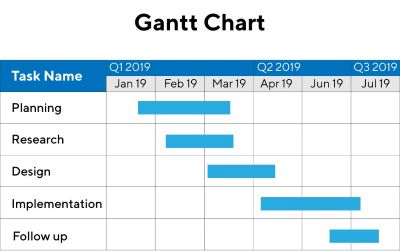
a chart in which a series of horizontal lines shows the amount of work done or completed in certain periods of time in a project
例:
•
The project manager used a Gantt chart to visualize the project timeline and task dependencies.
プロジェクトマネージャーは、プロジェクトのタイムラインとタスクの依存関係を視覚化するためにガントチャートを使用しました。
•
Creating a detailed Gantt chart helps in effective project planning and tracking.
詳細なガントチャートを作成することは、効果的なプロジェクト計画と追跡に役立ちます。