block graph
US /ˈblɑːk ˌɡræf/
UK /ˈblɒk ˌɡrɑːf/
名詞
ブロックグラフ
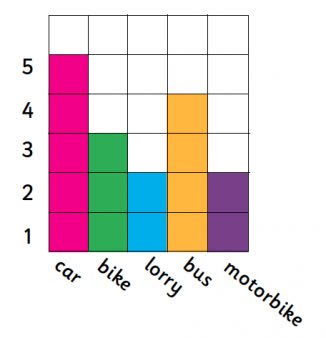
a graph that uses blocks to represent data, where each block typically represents one unit or a specific quantity, often used for simple data visualization.
例:
•
The teacher showed the students how to create a block graph to display the number of pets each student owned.
先生は生徒たちに、各生徒が飼っているペットの数を表示するためにブロックグラフを作成する方法を示しました。
•
We used a block graph to compare the favorite colors of the class.
クラスの好きな色を比較するためにブロックグラフを使用しました。