bar graph
US /ˈbɑːr ˌɡræf/
UK /ˈbɑː ɡrɑːf/
名詞
棒グラフ
a diagram in which the numerical values of variables are represented by the height or length of lines or rectangles of equal width
例:
•
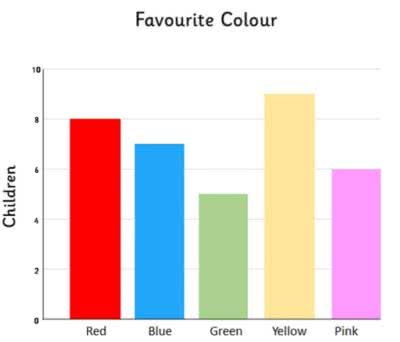
The teacher showed the students a bar graph illustrating the class's favorite colors.
先生は生徒たちに、クラスのお気に入りの色を示す棒グラフを見せた。
•
We used a bar graph to compare the sales figures of different products.
異なる製品の売上高を比較するために棒グラフを使用した。
同義語: