Arti kata "block graph" dalam bahasa Indonesia
Apa arti "block graph" dalam bahasa Inggris? Mari pelajari arti, pengucapan, dan cara penggunaan kata ini bersama Lingoland
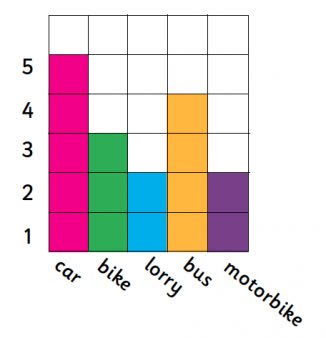
block graph
US /ˈblɑːk ˌɡræf/
UK /ˈblɒk ˌɡrɑːf/
Kata Benda
grafik balok
a graph that uses blocks to represent data, where each block typically represents one unit or a specific quantity, often used for simple data visualization.
Contoh:
•
The teacher showed the students how to create a block graph to display the number of pets each student owned.
Guru menunjukkan kepada siswa cara membuat grafik balok untuk menampilkan jumlah hewan peliharaan yang dimiliki setiap siswa.
•
We used a block graph to compare the favorite colors of the class.
Kami menggunakan grafik balok untuk membandingkan warna favorit kelas.
Sinonim:
Kata Terkait: