Signification du mot "pie chart" en français
Que signifie "pie chart" en anglais ? Découvrez la signification, la prononciation et l'utilisation spécifique de ce mot avec Lingoland
pie chart
US /ˈpaɪ ˌtʃɑːrt/
UK /ˈpaɪ ˌtʃɑːt/
Nom
diagramme circulaire, graphique en secteurs
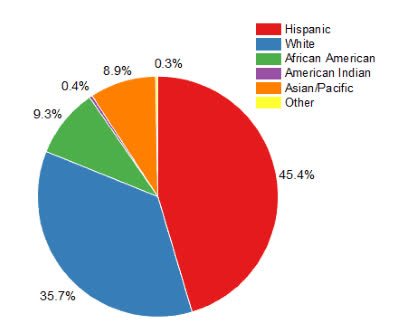
a type of graph in which a circle is divided into sectors that each represent a proportion of the whole
Exemple:
•
The report included a pie chart showing the distribution of expenses.
Le rapport comprenait un diagramme circulaire montrant la répartition des dépenses.
•
We used a pie chart to visualize the market share of different companies.
Nous avons utilisé un diagramme circulaire pour visualiser la part de marché des différentes entreprises.
Synonyme: