Signification du mot "Gantt chart" en français
Que signifie "Gantt chart" en anglais ? Découvrez la signification, la prononciation et l'utilisation spécifique de ce mot avec Lingoland
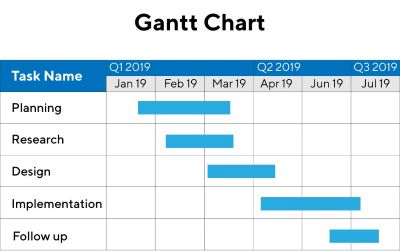
Gantt chart
US /ˈɡænt tʃɑːrt/
UK /ɡænt tʃɑːt/
Nom
diagramme de Gantt
a chart in which a series of horizontal lines shows the amount of work done or completed in certain periods of time in a project
Exemple:
•
The project manager used a Gantt chart to visualize the project timeline and task dependencies.
Le chef de projet a utilisé un diagramme de Gantt pour visualiser le calendrier du projet et les dépendances des tâches.
•
Creating a detailed Gantt chart helps in effective project planning and tracking.
La création d'un diagramme de Gantt détaillé aide à la planification et au suivi efficaces des projets.
Synonyme:
Mot Associé: