Significado de la palabra "bar graph" en español
¿Qué significa "bar graph" en inglés? Descubre el significado, la pronunciación y el uso específico de esta palabra con Lingoland
bar graph
US /ˈbɑːr ˌɡræf/
UK /ˈbɑː ɡrɑːf/
Sustantivo
gráfico de barras, diagrama de barras
a diagram in which the numerical values of variables are represented by the height or length of lines or rectangles of equal width
Ejemplo:
•
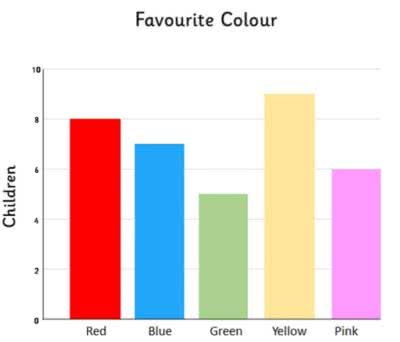
The teacher showed the students a bar graph illustrating the class's favorite colors.
El profesor mostró a los estudiantes un gráfico de barras que ilustraba los colores favoritos de la clase.
•
We used a bar graph to compare the sales figures of different products.
Utilizamos un gráfico de barras para comparar las cifras de ventas de diferentes productos.
Sinónimo:
Palabra Relacionada: