معنى الكلمة "line graph" بالعربية
ماذا تعني "line graph" بالإنجليزية؟ اكتشف المعنى، النطق، واستخدام هذه الكلمة مع Lingoland
line graph
US /ˈlaɪn ˌɡræf/
UK /ˈlaɪn ɡrɑːf/
اسم
رسم بياني خطي, مخطط خطي
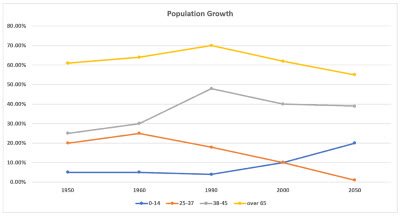
a graph that uses points connected by lines to show how something changes over time or in relation to something else
مثال:
•
The sales data was presented using a line graph to show trends over the last quarter.
تم عرض بيانات المبيعات باستخدام رسم بياني خطي لإظهار الاتجاهات خلال الربع الأخير.
•
A line graph is often used to visualize changes in temperature over a day.
يُستخدم الرسم البياني الخطي غالبًا لتصور التغيرات في درجة الحرارة على مدار اليوم.
مرادف:
كلمة مرتبطة: