معنى الكلمة "Gantt chart" بالعربية
ماذا تعني "Gantt chart" بالإنجليزية؟ اكتشف المعنى، النطق، واستخدام هذه الكلمة مع Lingoland
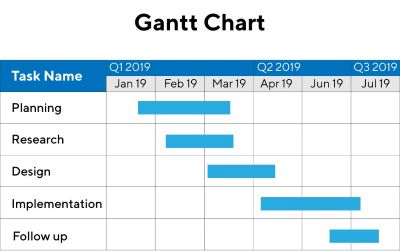
Gantt chart
US /ˈɡænt tʃɑːrt/
UK /ɡænt tʃɑːt/
اسم
مخطط جانت
a chart in which a series of horizontal lines shows the amount of work done or completed in certain periods of time in a project
مثال:
•
The project manager used a Gantt chart to visualize the project timeline and task dependencies.
استخدم مدير المشروع مخطط جانت لتصور الجدول الزمني للمشروع واعتمادات المهام.
•
Creating a detailed Gantt chart helps in effective project planning and tracking.
يساعد إنشاء مخطط جانت مفصل في التخطيط الفعال للمشروع وتتبعه.
كلمة مرتبطة: