scatter plot
US /ˈskæt̬.ɚ ˌplɑːt/
UK /ˈskæt.ə ˌplɒt/
名词
散点图
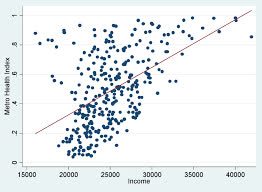
a graph in which the values of two variables are plotted along two axes, the pattern of the resulting points revealing any correlation present
示例:
•
The scatter plot shows a strong positive correlation between study hours and exam scores.
散点图显示了学习时间与考试成绩之间存在强正相关。
•
We need to create a scatter plot to visualize the distribution of the data.
我们需要创建一个散点图来可视化数据的分布。