bar graph
US /ˈbɑːr ˌɡræf/
UK /ˈbɑː ɡrɑːf/
名詞
條形圖, 柱狀圖
a diagram in which the numerical values of variables are represented by the height or length of lines or rectangles of equal width
範例:
•
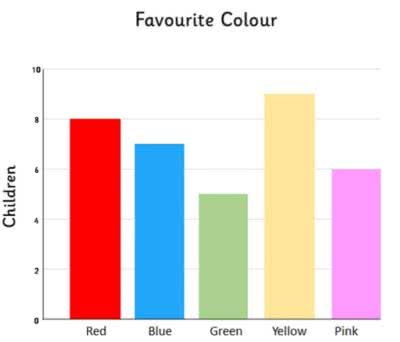
The teacher showed the students a bar graph illustrating the class's favorite colors.
老師給學生們看了一個條形圖,展示了班級最喜歡的顏色。
•
We used a bar graph to compare the sales figures of different products.
我們使用條形圖來比較不同產品的銷售數據。
同義詞: