"Gantt chart" kelimesinin Türkçe anlamı
"Gantt chart" İngilizce'de ne anlama geliyor? Lingoland ile bu kelimenin anlamını, telaffuzunu ve özel kullanımını keşfedin
Gantt chart
US /ˈɡænt tʃɑːrt/
UK /ɡænt tʃɑːt/
İsim
Gantt şeması
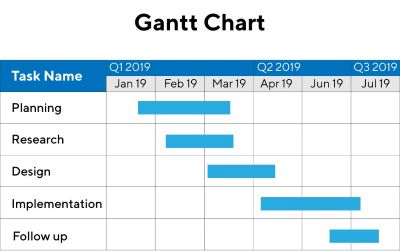
a chart in which a series of horizontal lines shows the amount of work done or completed in certain periods of time in a project
Örnek:
•
The project manager used a Gantt chart to visualize the project timeline and task dependencies.
Proje yöneticisi, proje zaman çizelgesini ve görev bağımlılıklarını görselleştirmek için bir Gantt şeması kullandı.
•
Creating a detailed Gantt chart helps in effective project planning and tracking.
Detaylı bir Gantt şeması oluşturmak, etkili proje planlaması ve takibine yardımcı olur.
Eş Anlamlı:
İlgili Kelime: