Betekenis van het woord "bar graph" in het Nederlands
Wat betekent "bar graph" in het Engels? Ontdek de betekenis, uitspraak en specifiek gebruik van dit woord met Lingoland
bar graph
US /ˈbɑːr ˌɡræf/
UK /ˈbɑː ɡrɑːf/
Zelfstandig Naamwoord
staafdiagram
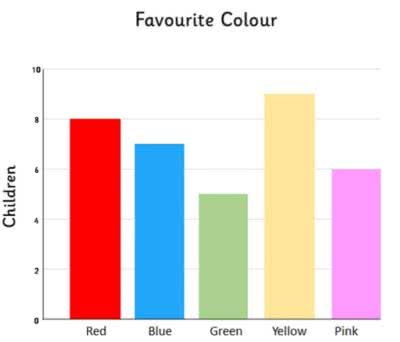
a diagram in which the numerical values of variables are represented by the height or length of lines or rectangles of equal width
Voorbeeld:
•
The teacher showed the students a bar graph illustrating the class's favorite colors.
De leraar liet de leerlingen een staafdiagram zien dat de favoriete kleuren van de klas illustreerde.
•
We used a bar graph to compare the sales figures of different products.
We gebruikten een staafdiagram om de verkoopcijfers van verschillende producten te vergelijken.
Synoniem:
Gerelateerd Woord: