histogram
US /ˈhɪs.tə.ɡræm/
UK /ˈhɪs.tə.ɡræm/
명사
히스토그램
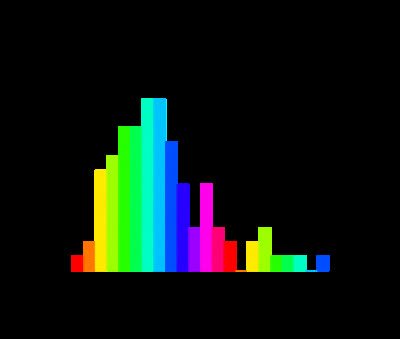
a diagram consisting of rectangles whose area is proportional to the frequency of a variable and whose width is equal to the class interval.
예시:
•
The data was visualized using a histogram to show the distribution of ages.
연령 분포를 보여주기 위해 히스토그램을 사용하여 데이터가 시각화되었습니다.
•
A frequency histogram provides a clear picture of the data's shape.
도수 히스토그램은 데이터의 형태를 명확하게 보여줍니다.