scatter plot
US /ˈskæt̬.ɚ ˌplɑːt/
UK /ˈskæt.ə ˌplɒt/
名詞
散布図
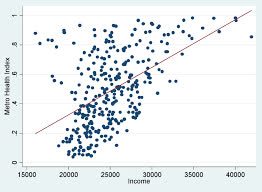
a graph in which the values of two variables are plotted along two axes, the pattern of the resulting points revealing any correlation present
例:
•
The scatter plot shows a strong positive correlation between study hours and exam scores.
散布図は、学習時間と試験のスコアの間に強い正の相関があることを示しています。
•
We need to create a scatter plot to visualize the distribution of the data.
データの分布を視覚化するために散布図を作成する必要があります。