Significato della parola "line graph" in italiano
Cosa significa "line graph" in inglese? Scopri il significato, la pronuncia e l'uso specifico di questa parola con Lingoland
line graph
US /ˈlaɪn ˌɡræf/
UK /ˈlaɪn ɡrɑːf/
Sostantivo
grafico a linee
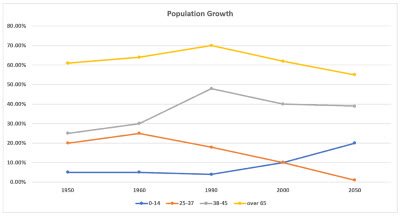
a graph that uses points connected by lines to show how something changes over time or in relation to something else
Esempio:
•
The sales data was presented using a line graph to show trends over the last quarter.
I dati di vendita sono stati presentati utilizzando un grafico a linee per mostrare le tendenze dell'ultimo trimestre.
•
A line graph is often used to visualize changes in temperature over a day.
Un grafico a linee è spesso usato per visualizzare i cambiamenti di temperatura durante una giornata.
Sinonimo:
Parola Correlata: